


Solar Images Saturday, 14 November 2026
‹ 12.11.2026 2026Photosphere sunspot drawing and RDS evaluation
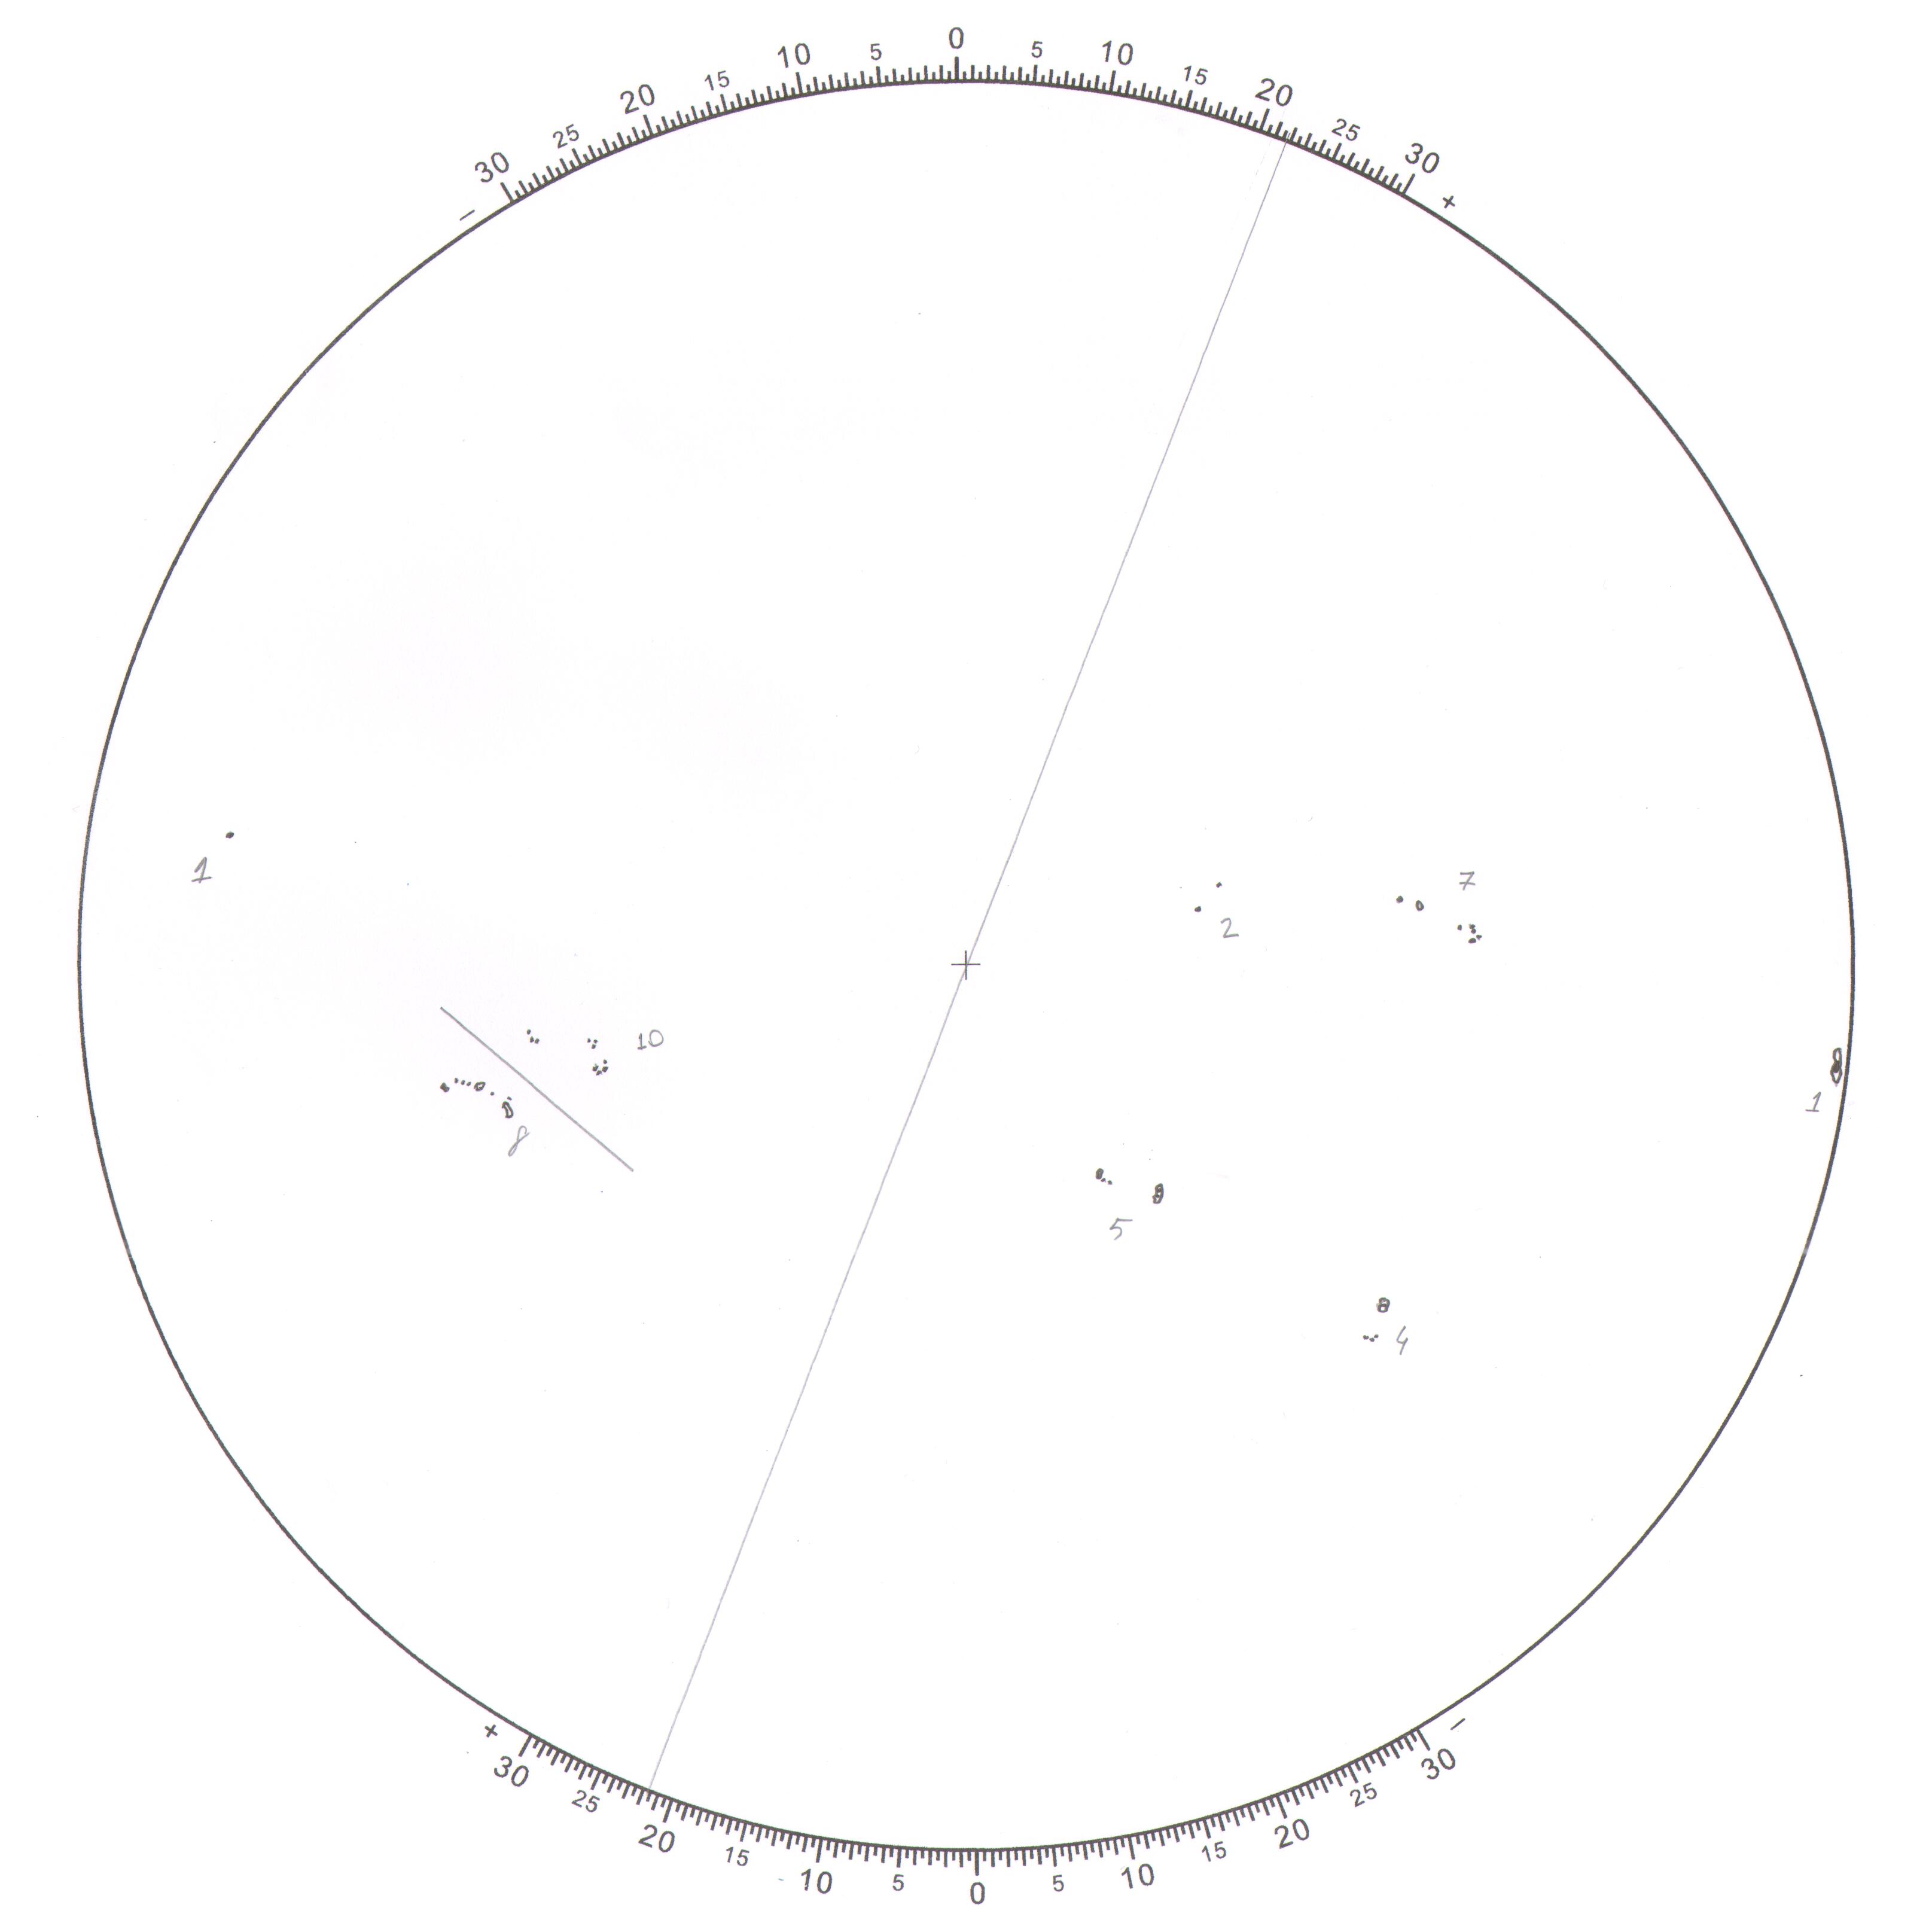
- Time
- 07:00 UT
- Observer
- Süleyman FİŞEK
- g
- 8
- f
- 38
- R
- 118
- Seeing
- 3 / 5
Sunspot groups and observation details →
Sunspot groups (from the drawing)
 Group 1 · AX_ – 2
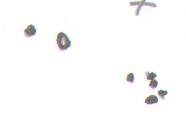 Group 2 · CSI – 7
 Group 3 · HH_ – 1
 Group 4 · AX_ – 1
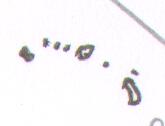 Group 5 · CAI – 8
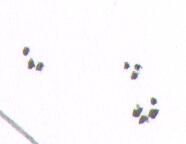 Group 6 · CRI – 10
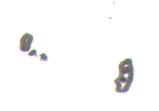 Group 7 · CSO – 5
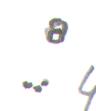 Group 8 · HS_ – 4
RDS data file (.gzd)
[Gözlem]
Tarih=14.11.2026
Saat=07:00
Gözlemci=Süleyman FİŞEK
KontrolEden=
Durumaçısı=21.59
Enlemaçısı=2.97
Boylamaçısı=70.23
Boylamfark=3
GKalite=3
GDurum=B.A , K.T
Kuzeyaçısı=-0.5
Sırano=20604
AyRasatNo=7
RasatÖnceki=12.11.2026
RasatSonraki=

[Leke Grupları]
Grupsayısı=8:3:5
LekeSayısı=38:10:28
RölatifSayı=118:40:78
01=AX_ 02 +12.770 -13.519 056.711 -1.000 0000 0 +13.993 -12.861 +11.547 -14.176
02=CSI 07 +16.558 -30.117 040.113 +0.000 0000 0 +17.459 -26.487 +15.657 -33.747 +16.558 -26.687 +16.558 -33.547
03=HH_ 01 +14.833 -83.138 347.920 -1.000 0000 0 +16.790 -80.769 +13.587 -85.507
04=AX_ 01 -07.586 +56.770 127.000 -1.000 0000 0 -07.299 +57.331 -07.872 +56.209
05=CAI 08 -16.806 +28.904 099.134 +0.000 0000 0 -15.916 +32.200 -17.696 +25.806 -16.806 +31.802 -16.806 +26.600
06=CRI 10 -11.427 +23.200 093.430 +0.000 0000 0 -10.241 +26.420 -12.612 +19.981 -11.427 +26.220 -11.427 +20.181
07=CSO 05 -06.368 -15.325 054.905 -1.000 0000 0 -05.570 -12.849 -07.166 -17.801
08=HS_ 04 -09.418 -36.300 034.200 -1.000 0000 0 -07.842 -35.323 -10.994 -36.737
20261114.gzd
Chromosphere (H-α) FITS frames
No chromosphere observation for this day.
Coronado H-α animations from frame sequences
No Coronado observation for this day.
On the Sun this day from the NOAA/SWPC event lists
| Time (UT) | Event | Region |
|---|---|---|
| 00:02–00:17 | C1.4 | 14578 in our drawing |
| 01:28–01:57 | C1.7 | 14578 in our drawing |
| 05:39–05:54 | C1.3 | 14576 in our drawing |
| 06:02–06:08 | C4.4 | 14568 in our drawing |
| 18:34–18:50 | C2.2 | 14576 in our drawing |
| 21:16–21:38 | C2.8 | 14579 in our drawing |
| 21:27–21:35 | radio type II/2 · shock ~1972 km/s | 14579 in our drawing |
| 21:32–23:08 | radio type IV/2 | 14579 in our drawing |
X-ray flares from the GOES satellites (C, M, X); H-α flares from ground stations (importance: S small, 1–4 larger; F/N/B faint/normal/brilliant; small S flares are listed only if they happened during our observation). A type II radio burst shows a shock wave (usually a coronal mass ejection). Chart: GOES X-ray flux (blue line; every peak is a flare, the letters on the right mark the classes); yellow strips are our chromosphere and blue strips our Coronado observing times.