


Daily Sunspot Evaluation
Observation Details Thursday, 12 November 2026
- No
- 20603
- Date
- 2026 / 11 / 12,448
- Time
- 10:45 UT
- Seeing
- 3 / 5
- Number of groups (g)
- 6
- Number of spots (f)
- 21
- Relative number (R)
- 81
- Lf
- 1
- P0
- 22.07°
- B0
- 3.18°
- L0
- 94.53°
- Observer
- Betül CİVELEKLER
Remarks: Görüntü Titremesi, Bulutlar Arasında, Hafif Sis, Kenar Titremesi
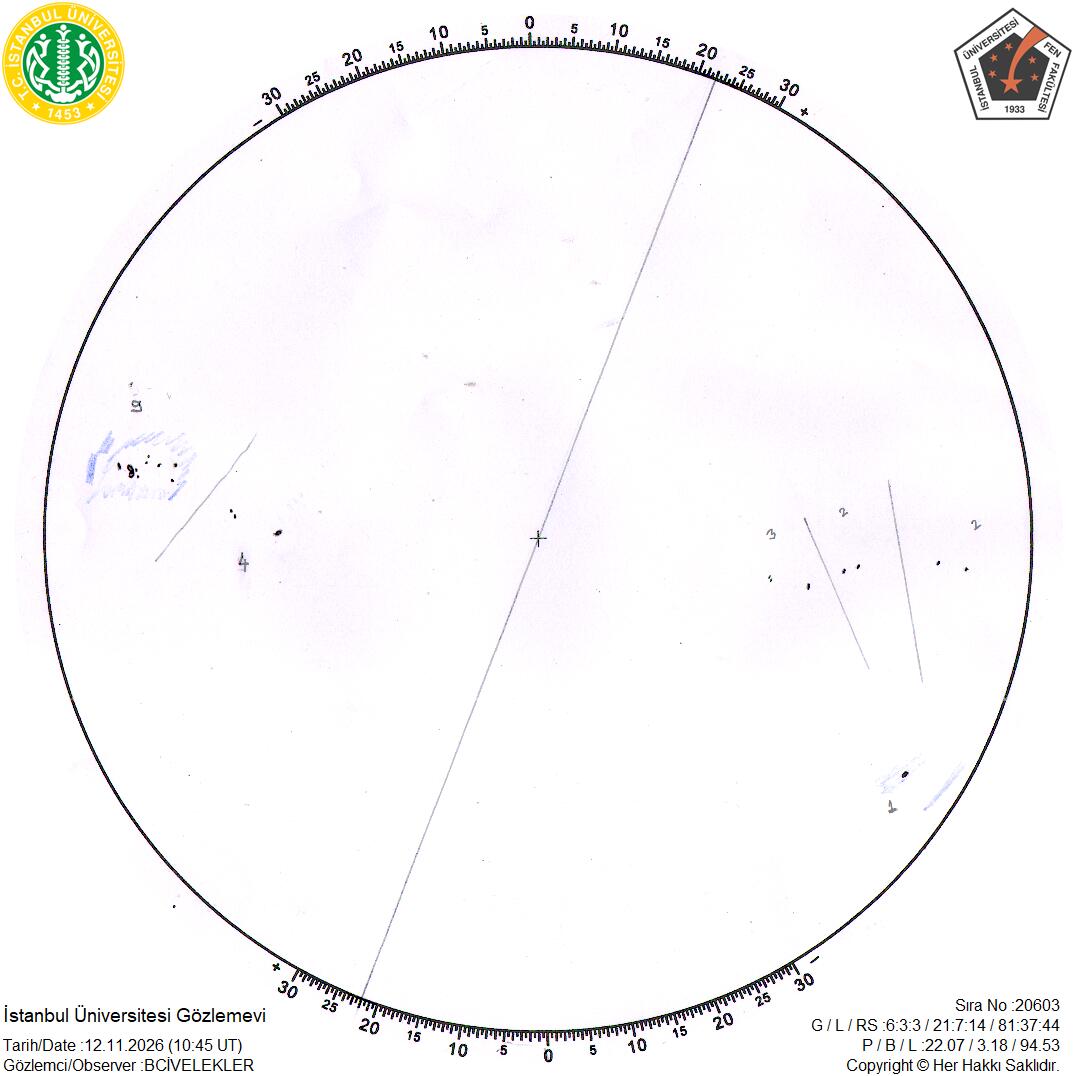
Comparison with a satellite image
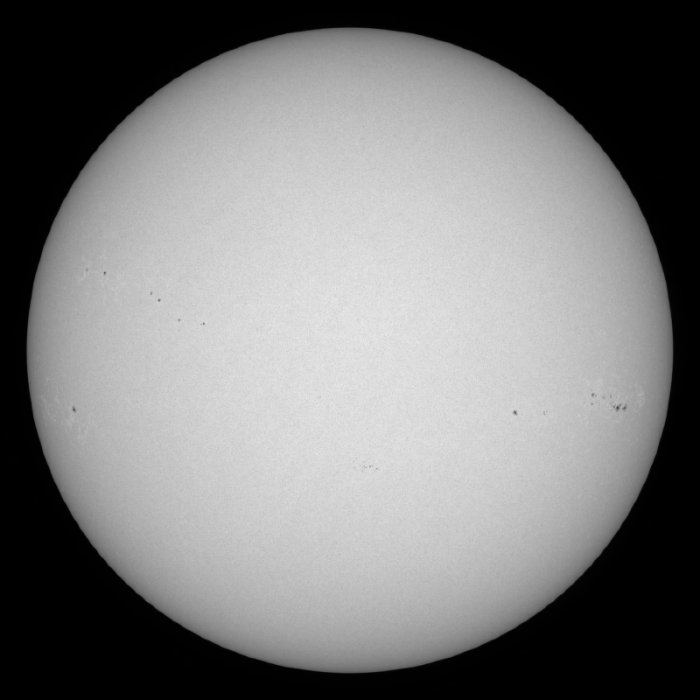
SDO/HMI white-light (continuum) image closest to the observation time: 10:44 UT. In the satellite image solar north is up; in the drawing the solar rotation axis is marked (P angle above). Image: NASA/SDO, HMI · Helioviewer.
Sunspot groups
| No | Group (class – spots) | B | Δ L | L | Δ Lf | U | NOAA | Flares (that day, UT) |
|---|---|---|---|---|---|---|---|---|
| 1 | BXO – 3 | 8.4 | 30.8E | 63.7 | 29.8E | 6.0 | 14573 | none whole life: 1 C |
| 2 | AX_ – 2 | 12.3 | 38.9E | 55.6 | 37.9E | 2.5 | 14572 | none |
| 3 | BXO – 2 | 16.2 | 57.1E | 37.4 | 56.1E | 7.1 | 14574 | none |
| 4 | CAI – 9 | -6.7 | 53.5W | 148 | 54.5W | 11.9 | 14566 | 15 C whole life: 8 M · 131 C |
| 5 | CRI – 4 | -7.5 | 33.6W | 128.1 | 34.6W | 8.0 | 14568 | none whole life: 1 C |
| 6 | HA_ – 1 | -8.8 | 61.3E | 33.3 | 60.3E | 1.6 | 14575 | none |
NOAA number and flares are an automatic match: the group’s latitude and Carrington longitude are compared with the NOAA/SWPC region list (at most 6°; hover over the number to see the distance). Flares are GOES X-ray events, for that UT day and for the whole life of the region. See Analyses.
‹ Previous Report for November 2026 Images of this day Next ›